The autonomy contract
How much an agent may do on its own, how it may learn, and the controls, readiness checks, and oversight capacity that earn each step up.
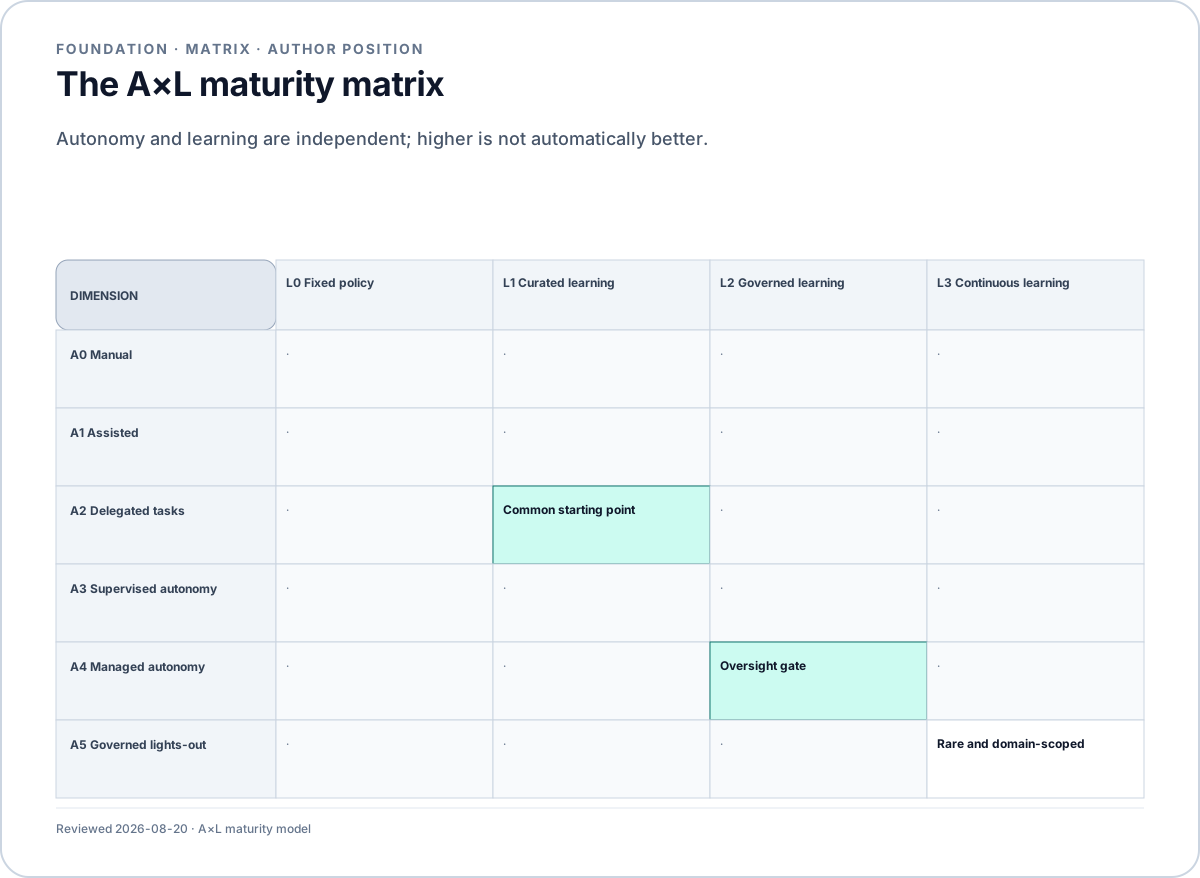
Two axes, applied per workload
In short: Each piece of work gets two settings, how independent the agent is and whether it may learn, both chosen on purpose and reversible.
The first axis is the autonomy level: who executes the work, and what the human keeps hold of. Its levels are A0 manual, A1 assisted, A2 delegated tasks, A3 supervised autonomy, A4 managed autonomy, and A5 governed lights-out. The second axis is the learning level: whether the agent improves, and under what control. Its levels are L0 fixed policy, L1 curated learning, L2 governed learning (the learning flywheel), and L3 continuous learning inside guardrails. The two axes move independently. Every workload sits somewhere on the grid deliberately, and movement is earned and reversible.
foundation · matrix
The A×L maturity matrix
Autonomy and learning are independent; higher is not automatically better.
A0 Manual
A1 Assisted
A2 Delegated tasks
- L1 Curated learning:Common starting point
A3 Supervised autonomy
A4 Managed autonomy
- L2 Governed learning:Oversight gate
A5 Governed lights-out
- L3 Continuous learning:Rare and domain-scoped
Diagram description: Six autonomy levels A0 through A5 crossed with four learning levels L0 through L3, with governed scaling emphasized in the middle of the matrix. The matrix crosses A0 Manual, A1 Assisted, A2 Delegated tasks, A3 Supervised autonomy, A4 Managed autonomy, A5 Governed lights-out with L0 Fixed policy, L1 Curated learning, L2 Governed learning, L3 Continuous learning. Annotated cells are A2 Delegated tasks by L1 Curated learning: Common starting point; A4 Managed autonomy by L2 Governed learning: Oversight gate; A5 Governed lights-out by L3 Continuous learning: Rare and domain-scoped.
The controls column is the contract
In short: Each step up in independence comes with a fixed list of controls, and that list, not the level name, is the agreement.
- Level
- A2
- Human role
- Review every output
- Required controls
- Task scoping, output review, audit
- Level
- A3
- Human role
- Approve irreversible actions, handle exceptions
- Required controls
- Approval gates, evals, budgets, kill switch
- Level
- A4
- Human role
- Manage exception queues, supervise
- Required controls
- Eval-gated change, cross-cutting concern register enforced, supervisor dashboards, designed oversight capacity
- Level
- A5
- Human role
- Set policy, own accountability, audit outcomes
- Required controls
- Proven eval maturity, continuous assurance, regulator-ready evidence, oversight capacity measured in production
Three rules connect the axes. A4 and above require L2 or better. At that level reliability must be improvable, not merely observable. A4 and above require proven oversight capacity. A level you cannot supervise is a level you have not reached. Without a learning loop you have a fixed-policy agent, not a teammate. Fixed policy is the right choice for many workloads, as long as it is named honestly.
Readiness gates autonomy
In short: Six areas of readiness are each scored from 0 to 3, and the weakest area, not the total, decides how much autonomy is safe.
Six dimensions are each scored from 0 to 3: absent, ad hoc, managed, operated. Data readiness includes ACL-aware retrievability, meaning retrieval that respects each person's access rights. Integration readiness covers governed API coverage (application programming interfaces, the defined ways software talks to software), tool exposure, and event availability. Identity readiness covers agents as first-class principals, on-behalf-of flows in which the agent acts with the requesting person's permissions, and secrets never held by agents. Operational discipline covers observability, offline and online evals, and incident practice. Governance and value discipline covers intake with kill criteria (agreed conditions for stopping), per-run cost visibility, and the two-estate view. The two estates are agents behind your own gateway and agents inside vendor products. The sixth dimension is operating capacity. The profile governs, never the total:
foundation · profile
Readiness is a profile, not a total score
The weakest relevant dimension constrains the workload’s autonomy ceiling.
Data readiness
0–3
Quality, ownership, permissions, provenance
Integration readiness
0–3
Governed APIs, tools, and event access
Identity readiness
0–3
ID2 principals, delegation, secrets, sponsor
Operational discipline
0–3
Observability, evals, incidents, drift
Governance and value discipline
0–3
Intake, risk, value, and per-run cost
Workforce and operating model
0–3
Owners, supervision capacity, and change
Diagram description: Six-part readiness profile covering data, integration, identity, operations, governance and value, and workforce without collapsing the dimensions into one score. The scorecard calls for Data readiness (Quality, ownership, permissions, provenance), Integration readiness (Governed APIs, tools, and event access), Identity readiness (ID2 principals, delegation, secrets, sponsor), Operational discipline (Observability, evals, incidents, drift), Governance and value discipline (Intake, risk, value, and per-run cost), Workforce and operating model (Owners, supervision capacity, and change).
- Profile
- Any dimension at 0 for the target workload
- Safe ceiling
- A1 only
- Profile
- Data and integration at 2+, others at 1+
- Safe ceiling
- A2
- Profile
- Data, integration, identity, and operations at 2+
- Safe ceiling
- A3
- Profile
- All six at 2+, operations and governance at 3
- Safe ceiling
- A4, and L2 governed learning is required
- Profile
- All six at 3, plus regulator-ready evidence
- Safe ceiling
- A5 candidacy, per domain only
Identity gaps cap autonomy without blocking a start. A workload can begin at A1 while the identity chain is built.
The oversight gate, as a burst rate
In short: No credible supervision ratio is published, so oversight capacity comes from queueing maths, budgeted per ten minutes, never daily.
No credible published human-to-agent supervision ratio exists from any source. The vendor that coined the metric has published no number in two annual editions. What transfers instead is queueing arithmetic and alarm-management standards:
foundation · profile
Design oversight for bursts, not averages
Exception demand is uneven, so safe autonomy depends on recoverable surge capacity.
- 1
Routine
Exceptions arrive within staffed capacity.
- 2
Weak signal
Several agents encounter the same upstream fault.
- 3
Burst
Correlated exceptions exceed the normal queue.
Gate · Capacity threshold
- 4
Degrade safely
Pause, narrow permissions, or return work to people.
- 5
Recover
Clear backlog and verify before restoring autonomy.
Measure arrival shape, handling time, and recoverability for each workload.
Diagram description: Timeline of low routine exception demand interrupted by a correlated incident burst that exceeds ordinary human review capacity and triggers degraded mode. The sequence contains 5 stages: 1, Routine: Exceptions arrive within staffed capacity.; 2, Weak signal: Several agents encounter the same upstream fault.; 3, Burst: Correlated exceptions exceed the normal queue., followed by the Capacity threshold gate; 4, Degrade safely: Pause, narrow permissions, or return work to people.; 5, Recover: Clear backlog and verify before restoring autonomy.. Important boundary: Measure arrival shape, handling time, and recoverability for each workload.
- Capacity follows the fan-out relation. Fan-out is how many agents one supervisor can watch at once. It equals neglect time (how long an agent can safely run unattended) divided by interaction time (how long a person needs per intervention) plus wait time. Leaving wait time out overstates capacity by up to 67 percent, and by 36 percent even in exception-only designs.
- Budgets are burst rates, never daily averages. Oversight budgets are set as burst rates per ten minutes (demand at its busiest, not averaged), never as daily averages. The alarm-management standards hold that a per-ten-minute rate cannot validly be converted to a longer window. They removed their per-day metric because averaging destroys its meaning. A daily-average target will be met on the dashboard and violated in every burst.
- Expect calibrated oversight, not a ratchet. Calibrated oversight means that with experience, standing permission broadens and intervention rates rise. In measured deployments, auto-approval roughly doubled while interrupt rates nearly doubled alongside it. Rising interventions with expanding autonomy is the system working. Falling interventions with expanding autonomy is the thing to investigate.
Measure these, as R13, the operating model layer, sets out. Track the intervention rate and its trend, the mix of escalations by trigger, wait time per item, and verification cost per review. Add periodic blind checks against self-reported figures.
The research behind this page
The learning flywheel
How agent behaviour improves over time without anyone losing control of it: tested promotion, calibrated judges, and staged rollout.
The concern matrix
Ten cross-cutting concerns against fourteen layers: who owns each, who enforces it, and the six gaps with no complete answer anywhere.